Data-Analytics---Crime-Data-Brazil
Data Analytics Crime Data Brazil
This project explores crime data in Brazil, focusing on the years 2011 and 2016.
It includes data cleaning, visualization with heatmaps, and analysis of crime trends over time.
Dataset: Crime Data in Brazil
Project Overview
The goal of this project is to:
- Analyze crime occurrences in different cities of São Paulo state
- Visualize crime hotspots using heatmaps
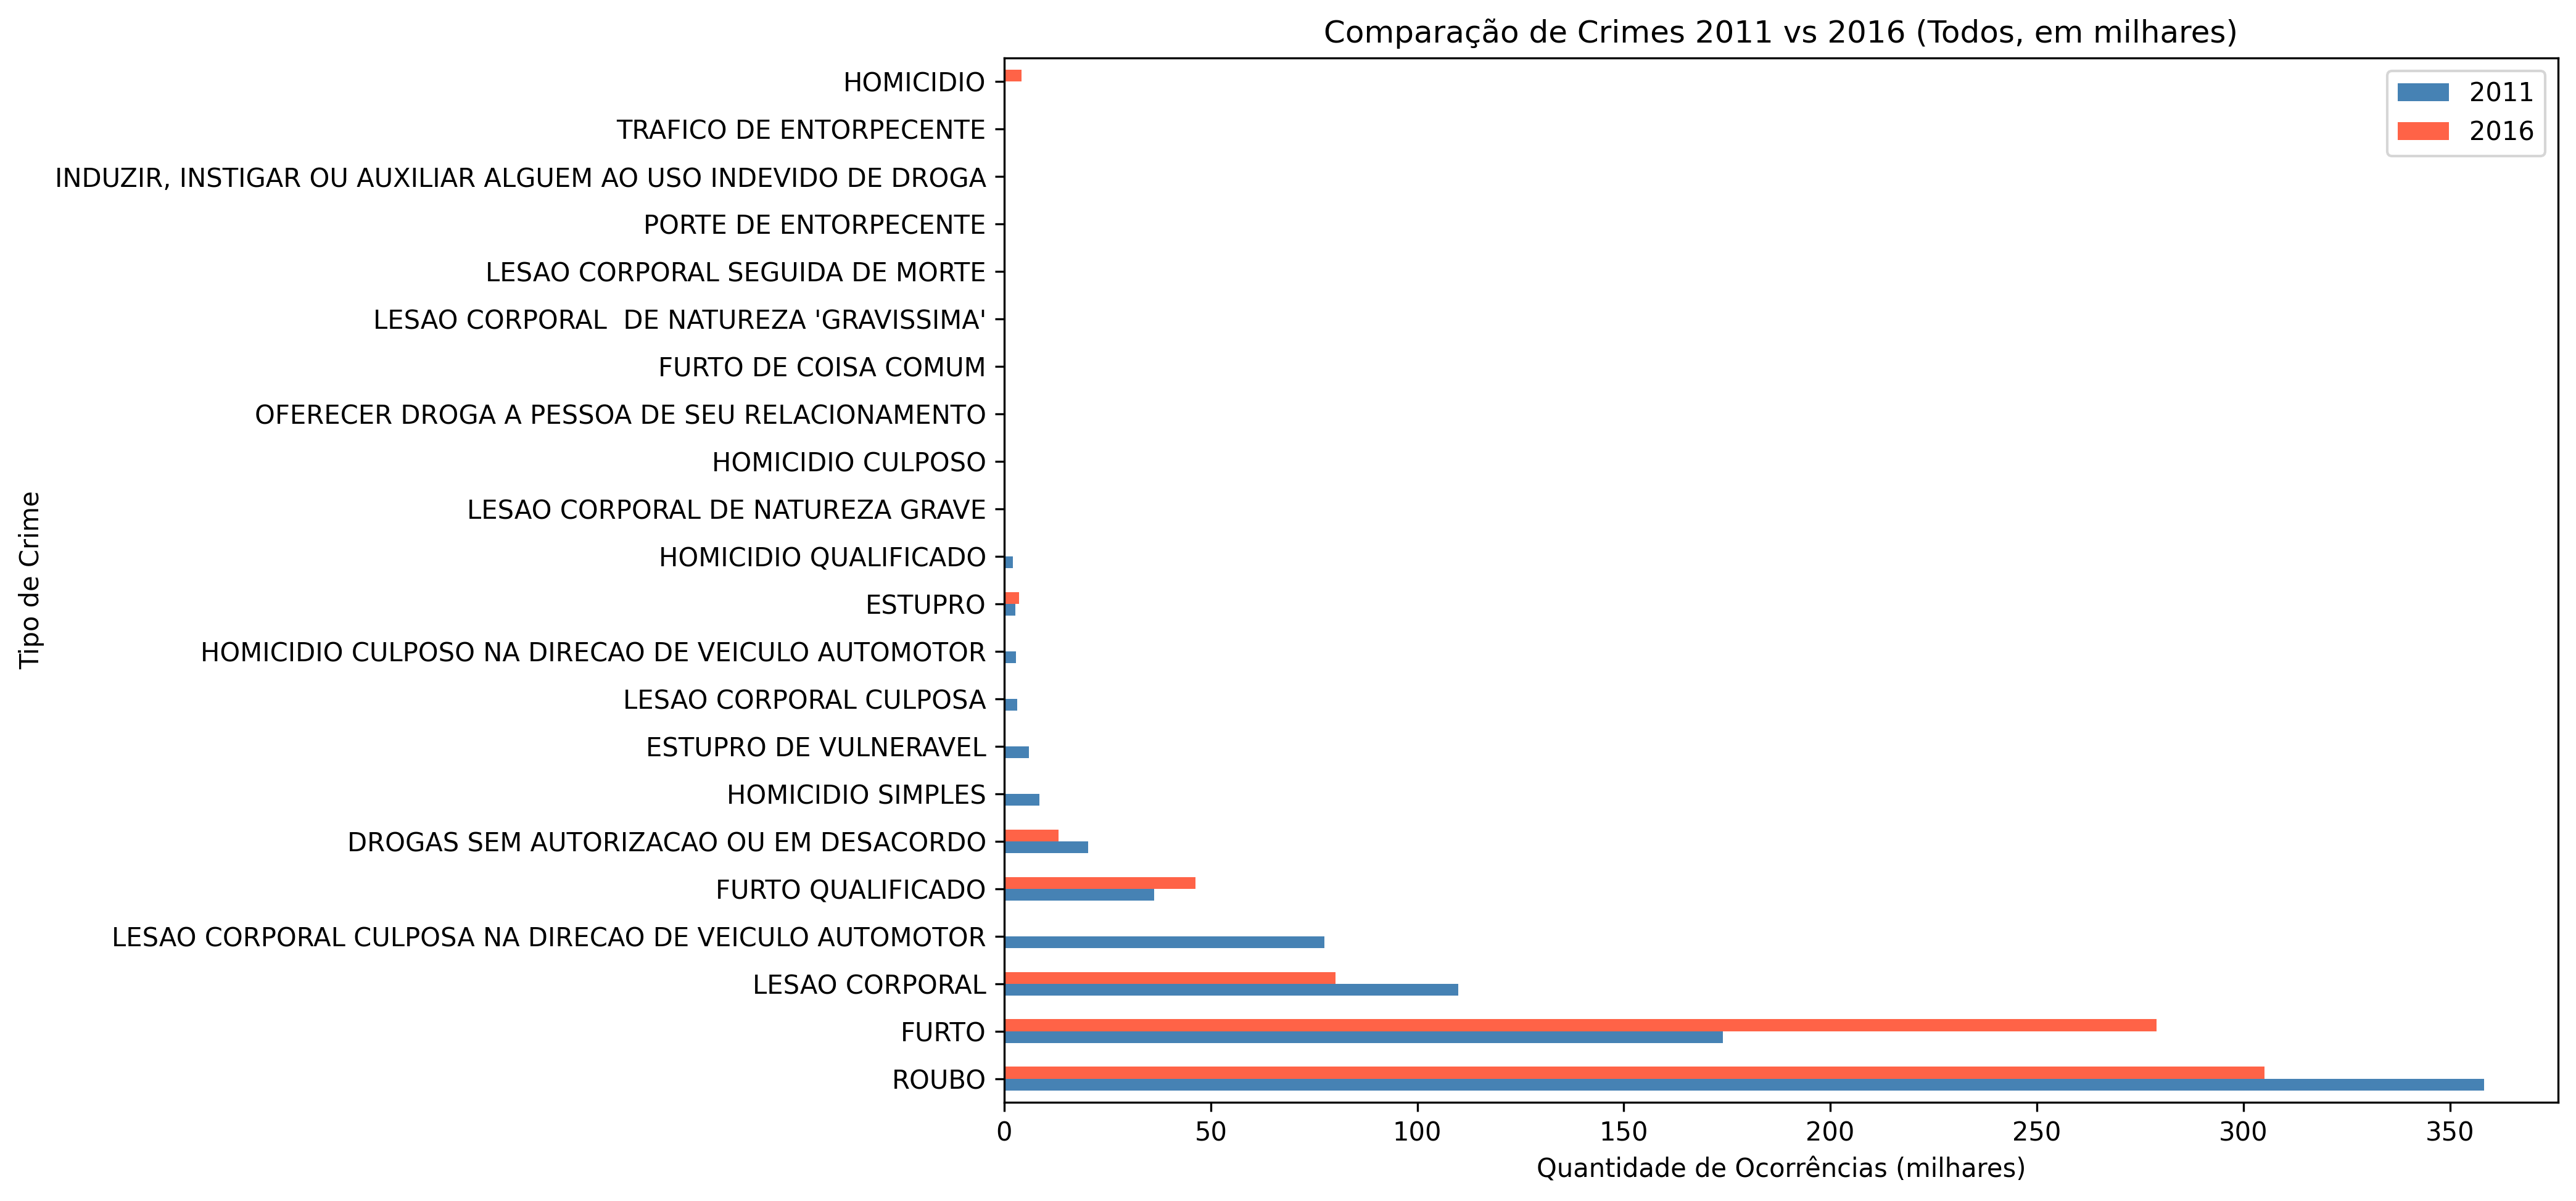
- Compare crime types between 2011 and 2016
- Highlight trends in specific types of crimes (e.g., Latitude, Longitude, City, Crime Type)
Visualizations
- Heatmaps
- Maps showing locations of crimes across São Paulo
- Color intensity indicates frequency of occurrences
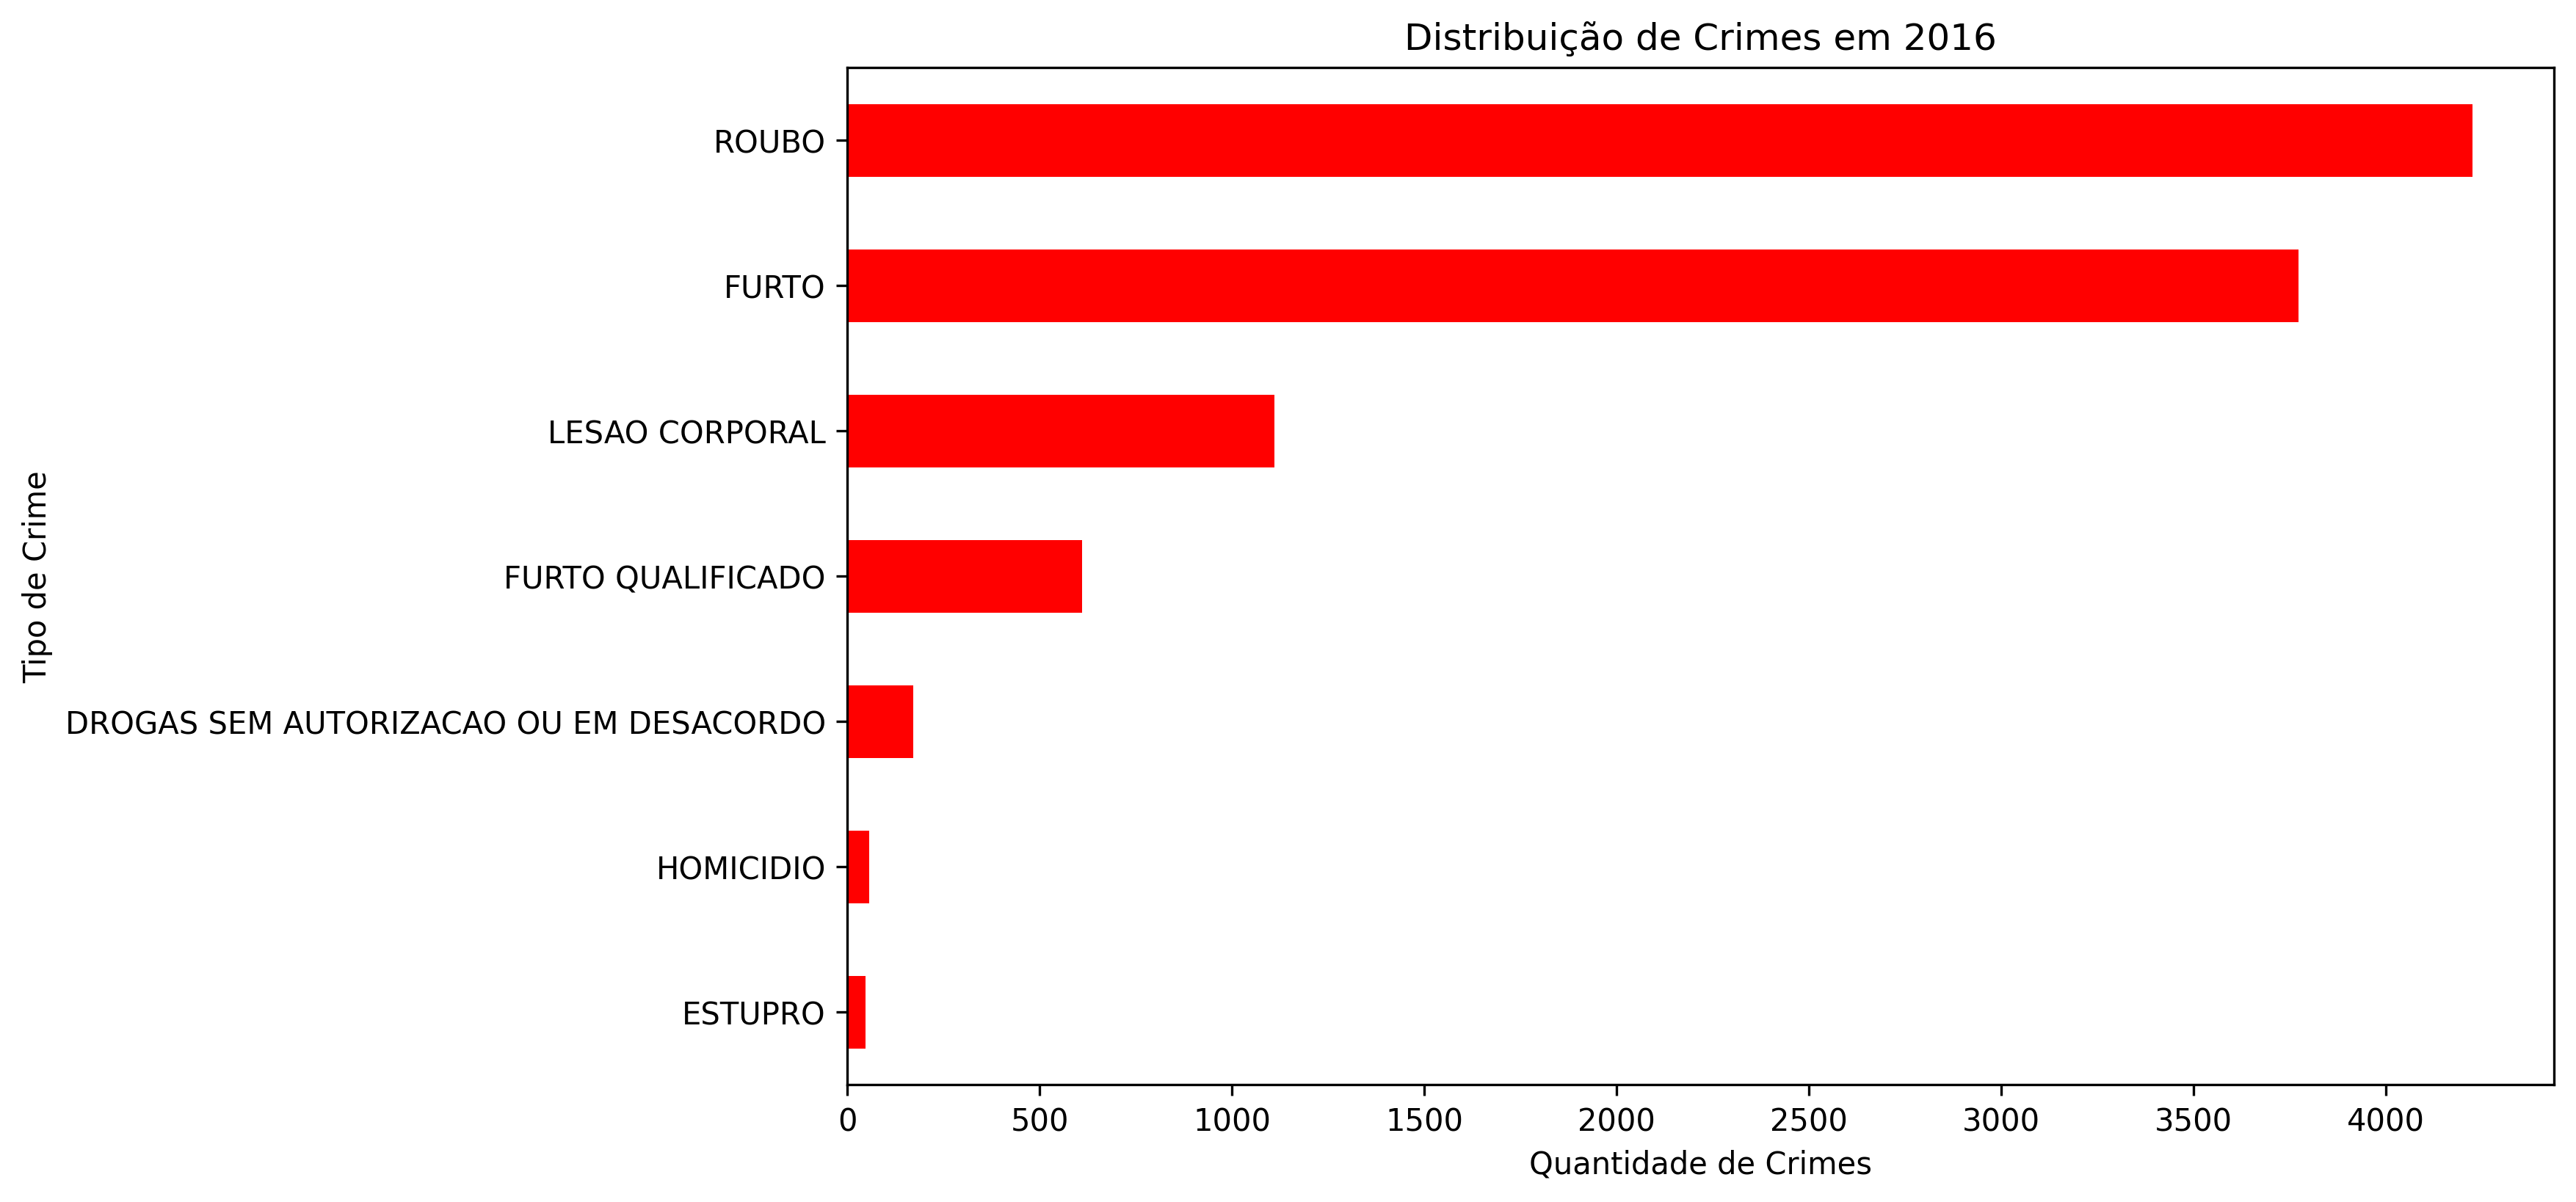
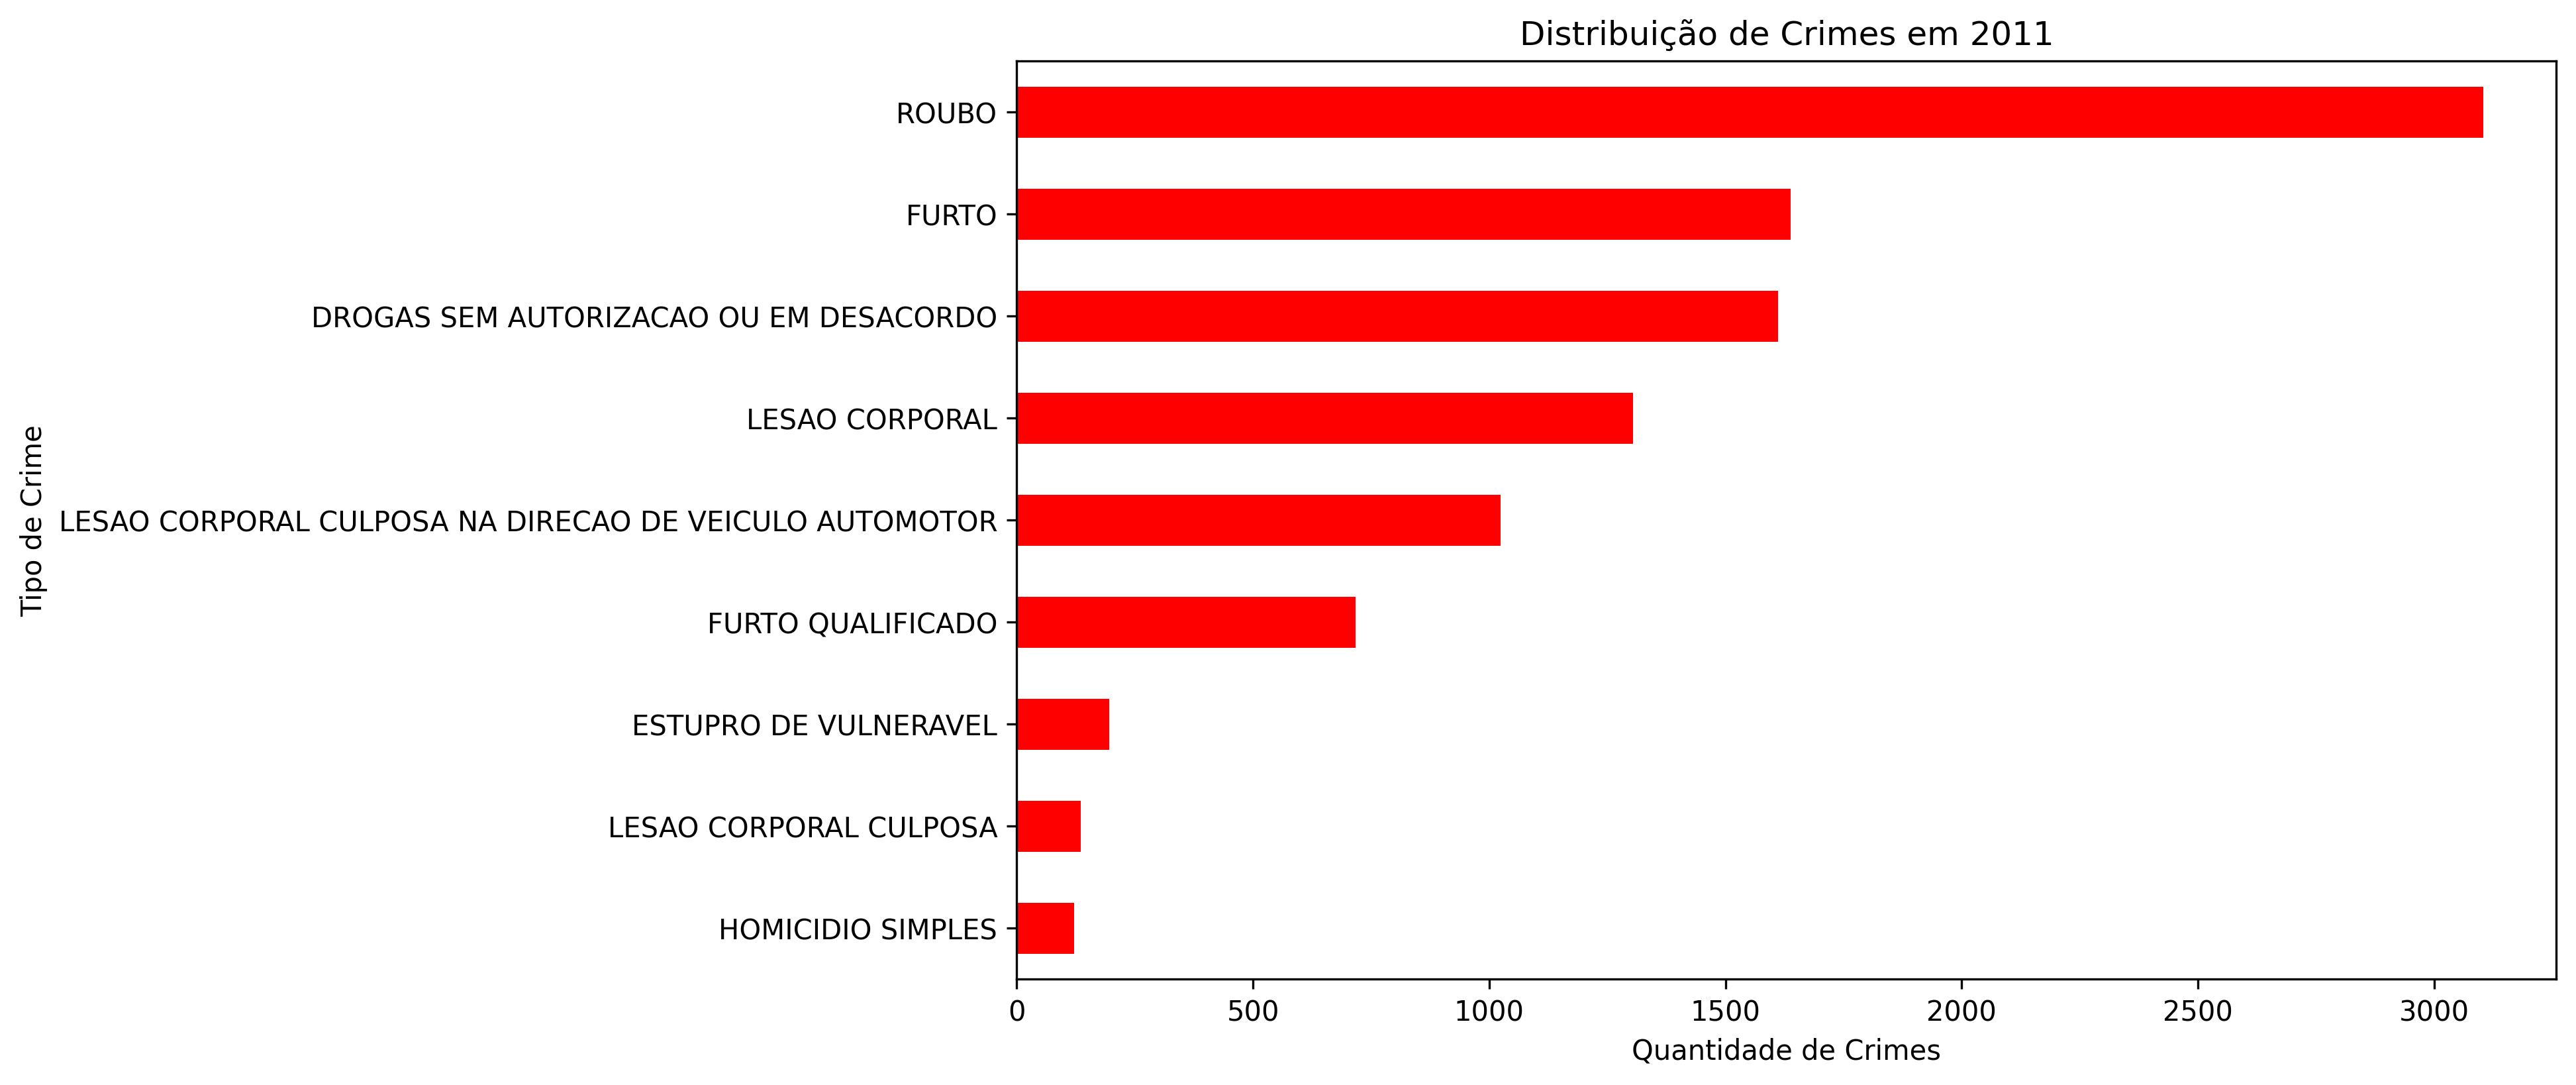
- Bar Charts
- Distribution of crime types per year
- Comparison of total occurrences between 2011 and 2016
Outputs

Tools and Technologies Used
- Python – data processing and analysis
- Pandas – data manipulation and cleaning
- Matplotlib – data visualization (bar charts and comparisons)
- Folium – geospatial visualization (heatmaps)
- Jupyter Notebook – interactive coding and exploration
- Git & GitHub – version control and project sharing